These are a few posts that came up as a result of my work in one consultancy project helping a team that worked on implementation of a SharePoint 2010 based system. My involvement into the project was not too long, only a month, and my tasks were mostly bringing break-through solutions for the most peculiar requirements or the most intricate integration points. Some of those solutions will be described in these posts.
- SharePoint 2010 Consultancy Project. Part 1 - Business Workflows
- SharePoint 2010 Consultancy Project. Part 3 - How to kill SharePoint farm with the help of SharePoint Designer
Part 2 – Reports
Requirements and Technical Solutions
The system required reports built for contracts in Proposals (some details about information organization were provided earlier in ‘Closing CR Tasks automatically on Resubmit’ section in Part 1. So additional complexity for the reports was brought by the fact that the library was not plain; it had more complicated structure with document sets pushing down some attributes from top level to document level, custom content types for contracts, InfoPath form promoting attributes and synchronizing some attributes up to document set level, and some other nice features.There were two types of reports required in the system
- Summary reports with aggregation calculations

- Grid reports with groups and totals
After analyzing requirements and keeping in mind that the solutions should be as simple as possible it looked like the best option for summary reports would be MS SQL Server Reporting Services (using Reports Builder 3.0) and for grid reports – SharePoint Designer Data Views. Both approaches were more or less out-of-the-box, which complied with supportability requirements.
After prototypes for summary reports based on SSRS had been finished, customer realized that it will be a delay in getting proper licenses for SSRS so the technical solution for summary reports should be reconsidered. At this point I had two solution candidates one based on custom web parts created in Visual Studio and SPD Data Views as for grid reports. SPD Data View won because of supportability requirements.
Summary reports with SPD Data Views
Data Sources and Parameters
The most intricate part in building Data View web parts for summary reports appeared in configuring data source.There are two options to add Data View to the page – first one is to insert web part initially based on one of the lists, the second – add an empty web part and after that select needed list as a data source for the web part. It looks like both options are to achieve the same but surprisingly with the first option less functionality is available for manipulating data source. So the tip here is: insert an empty Data View web part and after that bind data source to a list or document library.
From now you can configure the options for a data source. Note that all those configurations will guide how CAML querying SharePoint objects is built, which is important for performance.

- Selecting needed fields. Here you can “unselect” columns that will not be needed for data view, which is good because extra columns will not annoy you when building views and secondly the CAML query will be optimized for better performance as mentioned above
- Filters. Again for better performance it is important to configure all needed filters here on the level of data source (alternatively XSLT filters can be added).
In those filters it is also possible to use Data View parameters. As you can see on picture above DateFrom and DateTo values are taken from relevant parameters. There are several types of parameters – they can be introduced as Control, Cookie, Form, Query String, or Server Variable.
Another nice feature for filter conditions is that I can group sub-conditions to manage precedence of logical operations - Sort
- Folder scope. For my tasks it was critical to query all contracts inside document sets, so fortunately I had this option for data source (it was really frustrating when I was not able to configure folder scope for SharePoint data source in Reporting Services)
Building Reports
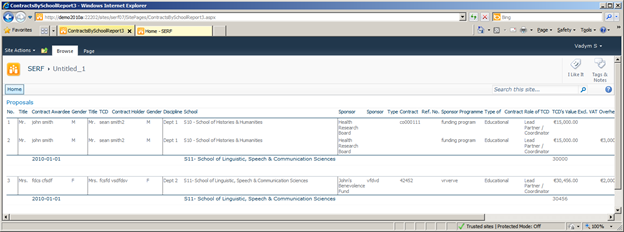
Data View web parts suit perfectly for building data grid reports. For summary reports, when only groups and totals are displayed, it is trickier. Basically this can be achieved with “Sort & Group” functionality.
Problem 1 – Overall Total
Even for simple case with only one grouping level, adding overall total is not really straightforward.
Even for simple case with only one grouping level, adding overall total is not really straightforward.
In example on picture below, all contracts are grouped by some property and totals are calculated for those groups. This can be done with simple group settings: for my group set ‘Show group footer’ and in ‘Advanced Grouping’ set ‘Always hide group details’. Then calculations for group totals can be done with formulas, e.g. format-number(sum($nodeset/@BC_TCDValueExclVat.),'#,###.00')
But I cannot easily add formulas for overall totals because there is not even a placeholder for them. Obviously you can go to the Code view again, and having enough knowledge in XSLT, add needed elements there, but this does not really sound as out-of-the-box. In my case it was easier because data source (SharePoint document library) had a column IsContract indicating if an item is contract or not. Since reports were built for contracts only, all items coming from data source had value ‘Yes’ in IsContract column. Now the trick is that I can build two levels of grouping: first based on IsContract columns (there will be only one group all the time) and then a property for actual grouping. Then I can use headers and footers for IsContract group level for overall totals.

Problem 2 – Incorrect totals for grouping hierarchies with more than two columns
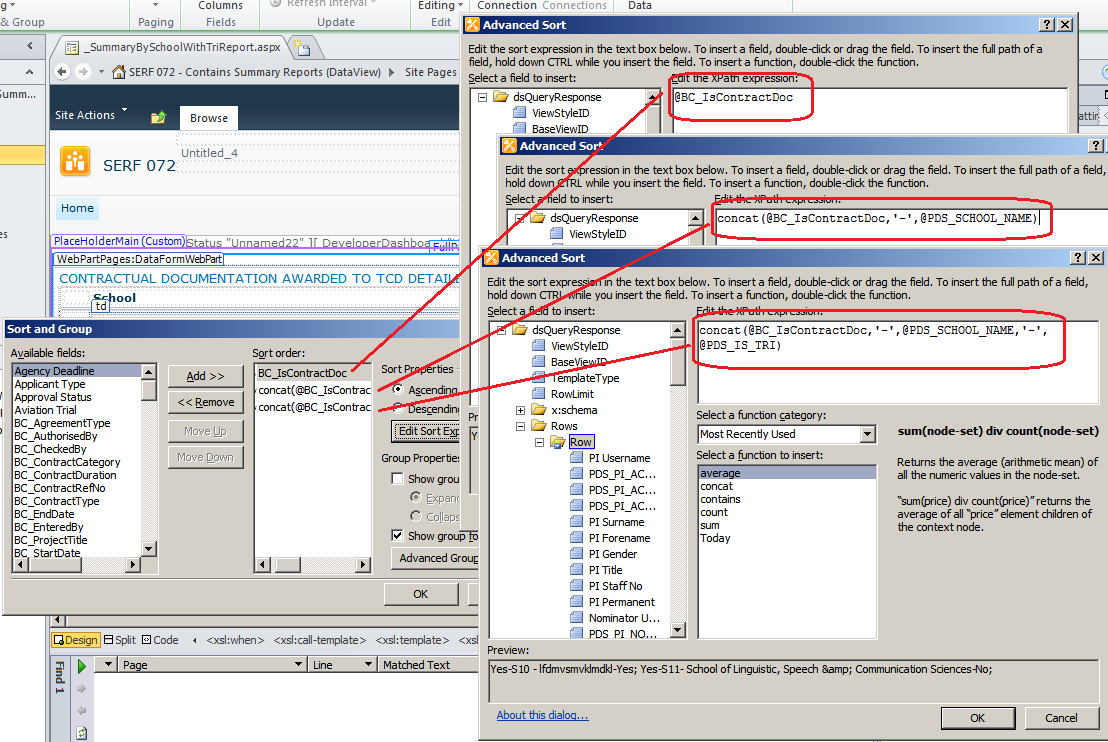
That solution with overall total worked fine for me until I needed more than two levels of hierarchy. After I added third column to grouping hierarchy I realized that totals are calculated incorrectly. After inspecting XSL code for I found a simple solution to fix incorrect totals – names for group levels should be hierarchical themselves (see the picture below):
That solution with overall total worked fine for me until I needed more than two levels of hierarchy. After I added third column to grouping hierarchy I realized that totals are calculated incorrectly. After inspecting XSL code for I found a simple solution to fix incorrect totals – names for group levels should be hierarchical themselves (see the picture below):
Problem 3 – Report with two hierarchies
Initially, when I just met the problem 2 described above and until I found a solution for it, I was really disappointed with the way SPD builds those groupings. But later it helped me building another report with two hierarchies under one overall total. As shown on picture below the report displayed two parts based on the type of contract – Awarded To and Awarded By. Inside those parts there were groups of contracts based on two different properties. Those ‘To’ and ‘By’ parts could be split into two separate reports but overall totals were needed, which made them appear on the same report.
Initially, when I just met the problem 2 described above and until I found a solution for it, I was really disappointed with the way SPD builds those groupings. But later it helped me building another report with two hierarchies under one overall total. As shown on picture below the report displayed two parts based on the type of contract – Awarded To and Awarded By. Inside those parts there were groups of contracts based on two different properties. Those ‘To’ and ‘By’ parts could be split into two separate reports but overall totals were needed, which made them appear on the same report.
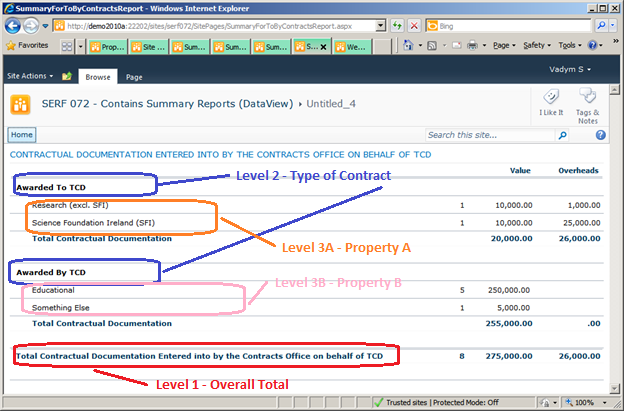
The solution was to build one data view web part with 4 groups representing two grouping hierarchies as shown on picture below. Note that the top level is just to get overall totals as it was described in ‘Problem
2’.

One more thing to be done for displaying report correctly was to define conditional formatting rules hiding or showing elements depending on report part.
Deployment
Another intricate thing with data view web parts is deployment. It looks like data views are not supposed for moving from one site to another. The problem is that data source for data view web part is bound to the SharePoint list (or library) by its GUID. Obviously the GUID of data source will be different on destination site. Although there is a workaround changing web part to make it deployable. Basically, it suggests replacing GUID with list name. This is described in several blogs but neither of them worked for me 100% so after a series of “experiments” I found some modifications to be done to make it working. So here is the procedure that worked for me.
Preparing deployment package
- In SharePoint Designer open site page in code view and make the following changes:
- Set ViewFlag attribute to 0 in WebPartPages:DataFormWebPart element.
Change ListId to ListName and replace list’s GUID with list name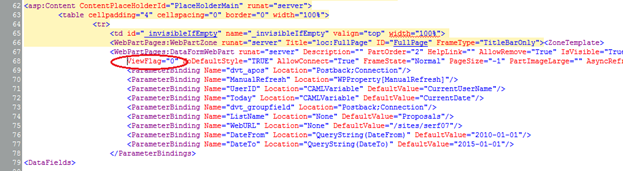
- In SharePoint:SPDDataSource element

- Remove Update, Insert, Delete parameters
- In SelectParameters change ListId to ListName and change DefaultValue to list name instead of GUID.
- Add another parameter into SelectParameters as following setting proper link to current site <WebPartPages:DataFormParameter ParameterKey="WebURL" PropertyName="ParameterValues" DefaultValue="/sites/serf07" Name="WebURL"></WebPartPages:DataFormParameter>
- In stylesheet replace ListID with ListName and list’s GUID with its name
- In SPD (Design View) select Data View web part and then in Data View Tools -> Web Part save web part to file. This file will be used to deploy report to any other site collections
Deploying reports
Deployment package for reports consists of the web part file created as described in previous section.
Deployment instructions:
- Open web part file in text editor and modify WebURL specifying URL of the site where web part will be deployed to
- Upload web part to Web Parts Gallery (Site Settings -> Galleries -> Web Parts)
- Create site pages and add web parts
Consequences of changing GUID to list name
Price for changing GUID to list name was that some settings were not available after web part became “deployment-ready”. In data source configuration all buttons for Fields, Filter, Sort, and scope became grayed. Even more, when I tried to modify parameters, which were used in filter conditions, the whole page got broken. So from now to make required changes I had to switch to code view very often.
Summary reports with Reporting Services
As it was mentioned earlier Reporting Services were considered as the most appropriate solution for implementing summary reports. As a tool for creating reports the best candidate was Report Builder 3.0. Another available option was using SQL Server Business Intelligence Development Studio, which in fact is Visual Studio 2008 with BI templates for SSAS, SSIS, Reporting, etc. It is interesting that BI templates are not available in VS2010.
So Report Builder 3.0 is a nice tool, well integrated with SharePoint (click-once application), providing almost the same possibilities as BI Visual Studio but more user friendly with lots of wizards.
Not much to say about report building process – there is a lot of materials on web. The only thing to mention here is limitations of SharePoint data source related to document sets (more exactly to folders).
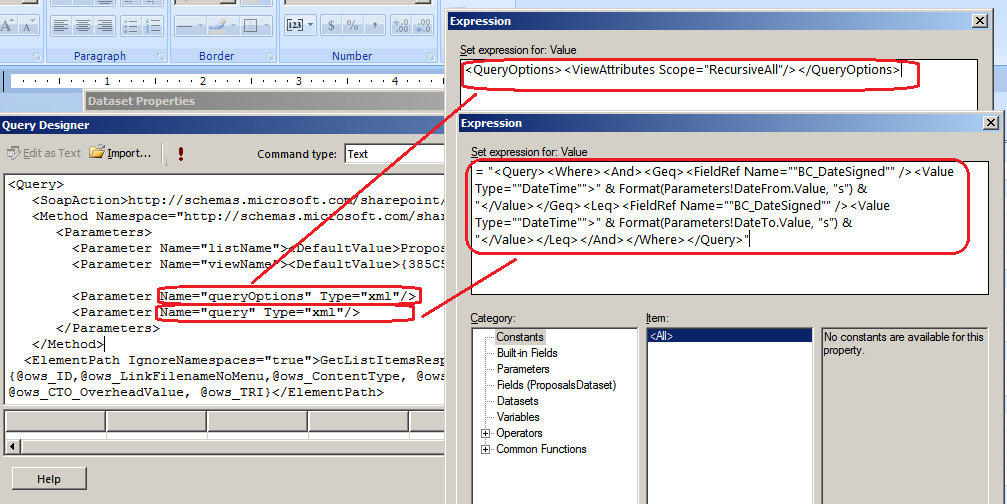
Building data source and data sets for my reports the best option seemed to be using a data source of ‘Microsoft SharePoint List’. With this data source I could have a nice query designer tool to create a CAML query retrieving my data. But somehow with this data source there is no way to specify QueryOptions to request Scope='Recursive'. So unfortunately it did not work for me completely because I had to retrieve documents inside a document set.
Another option was using XML data source and connecting to SharePoint web services to retrieve list data. In this case there is no nice Query Designer and another complication was that passing parameters to web service was not straightforward.
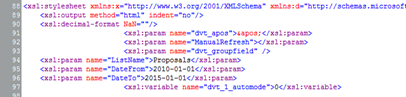
Steps and screenshots below show how to get list items from folders recursively:
- Configuring Data Source to SharePoint web services:

- Configuring Data Set and parameters
Change ListId to ListName and replace list’s GUID with list name
No comments:
Post a Comment